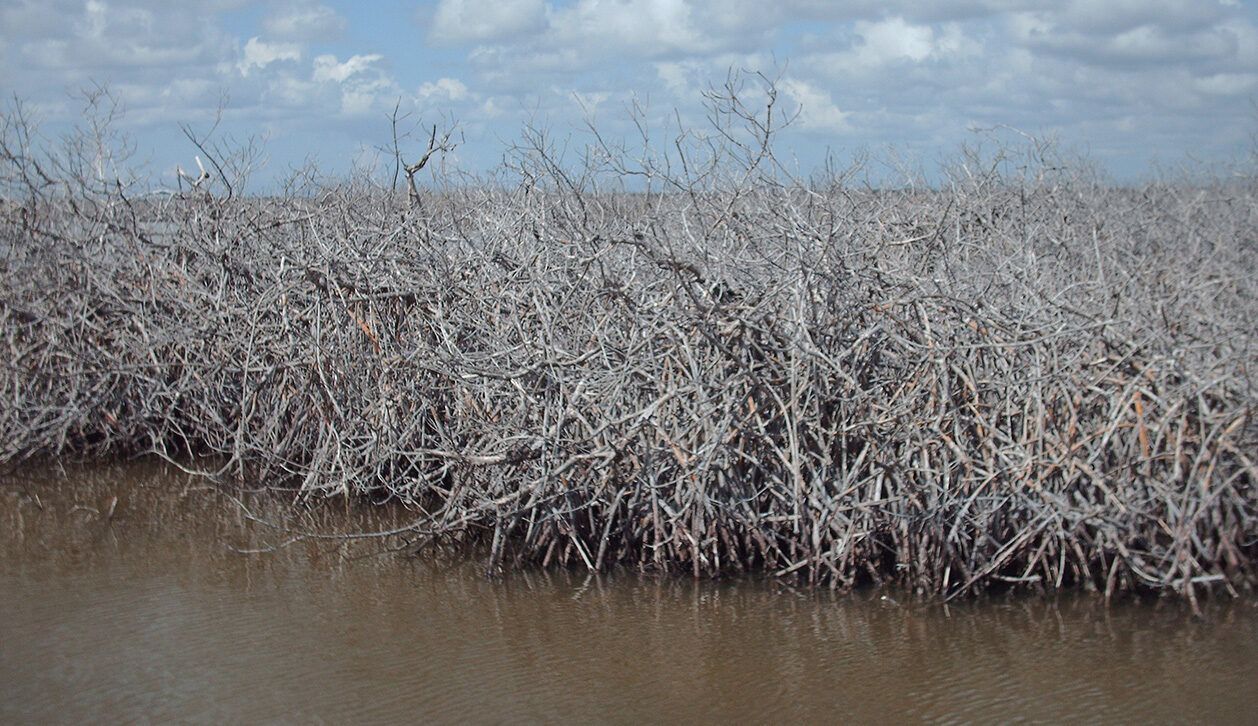
Damage to mangroves by high winds as a result of a tropical storm
Place: Mexico / Author: Jorge Herrera
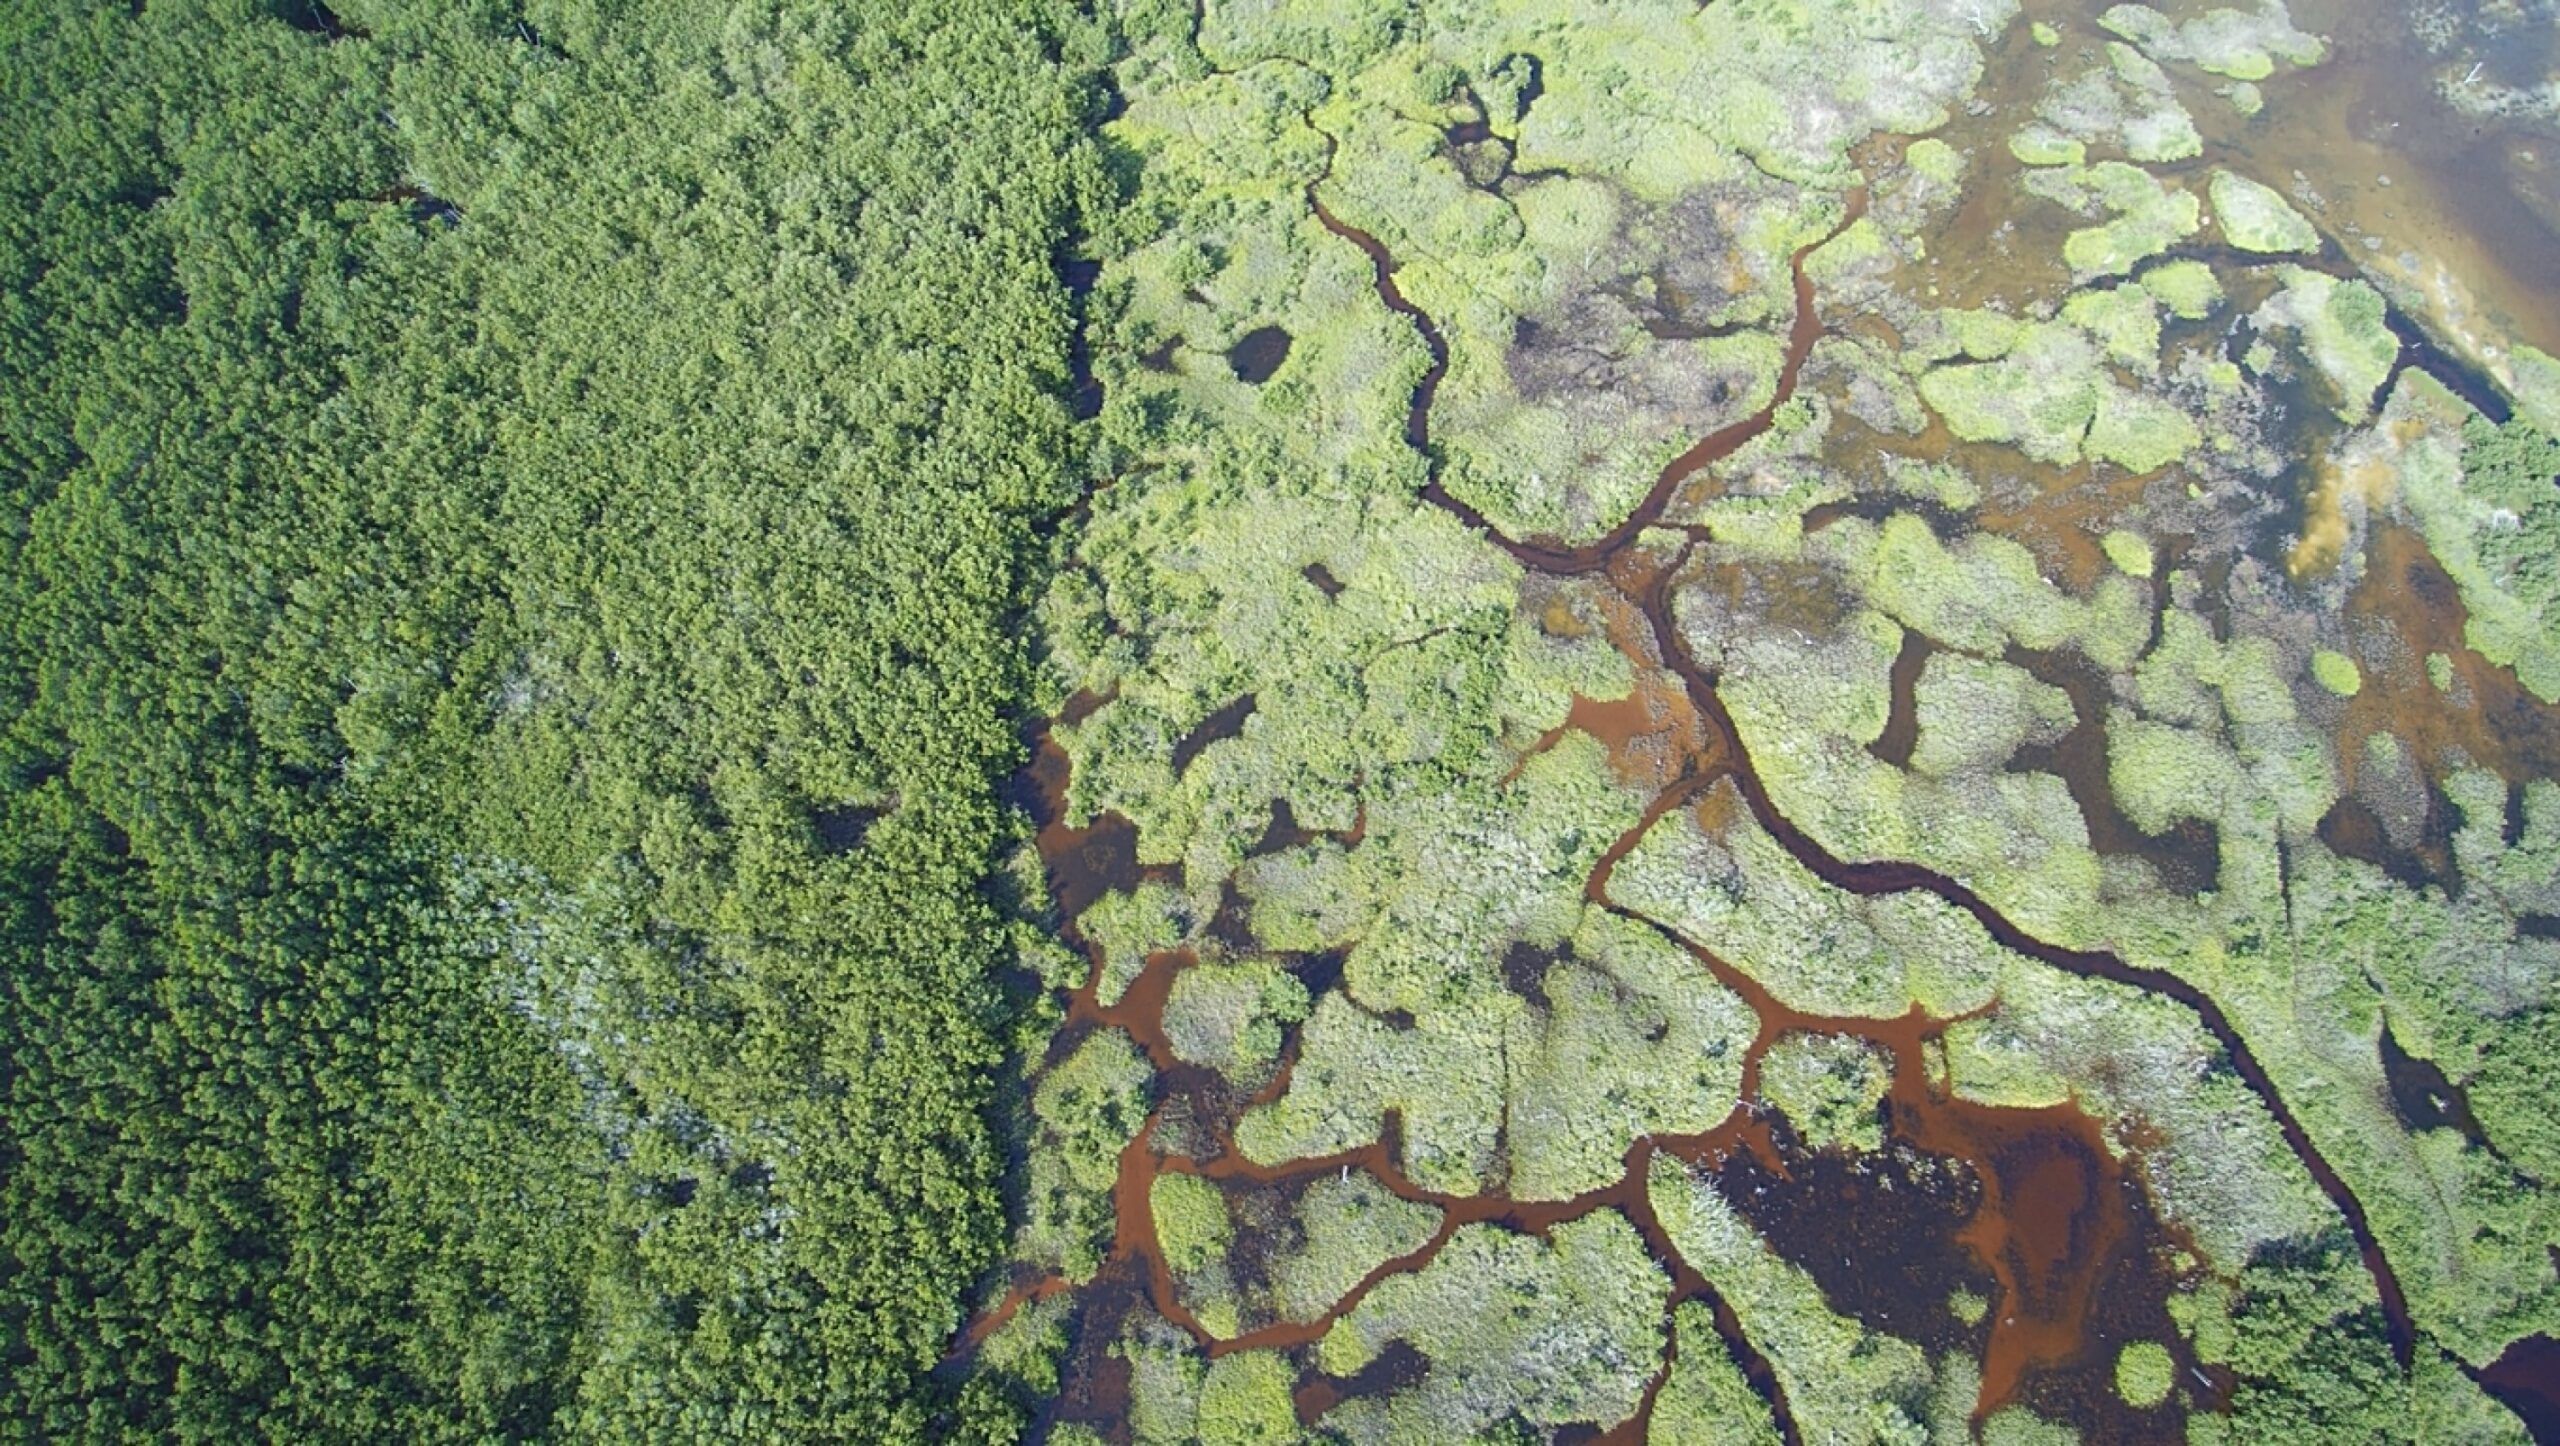
Mangrove forest area damaged by floods at the end of the mega-hurricane season of 2017
Place: Yucatan / Author: Jorge Herrera
Floods
Some of the greatest damage associated with hurricanes and tropical storms is the massive quantity of rainfall they bring within a short timespan.
More than the impact of the wind, which is the classic variable of a hurricane, what is most affecting the coastal and marine ecosystems, and human society is the impact of the rain.
Flood damage increases with that of tropical storms. This is largely due to the fact that the tropical storms are becoming slower, are wetter, and more frequent.
The region has gone from accumulating 93 tropical storms in the decade of 1980, to registering 155 tropical storms in the decade of 2010. This is a 66% increase. The most affected regions with the highest frequency of hurricane impact are the Antilles Islands, including the Greater Antilles and the Minor Antilles; followed by Yucatan, Honduras and Nicaragua.
Damage to mangroves by high winds as a result of a tropical storm. Cozumel Island, Mexico. Source: Jorge Herrera, CINVESTAV
Climate change and hurricane flooding
The global warming of the planet has three fundamental effects on hurricanes, with consequences on the amount of rainfall they leave on their path:
Mangrove forest area damaged by floods at the end of the mega-hurricane season of 2017. Source: Jorge Herrera, CINVESTAV
Increased frequency of hurricanes: hurricanes only form if the ocean temperature is the same or above 26.5ºC. The hotter the atmosphere, the hotter the ocean, the more hurricanes form.
Increased availability of atmospheric humidity: the planetary heat warms the atmosphere. A warmer atmosphere retains more humidity. This means a greater availability of rain associated with hurricanes.
The time of permanence of the hurricanes is longer: the eye of the hurricane is moving at ever slower speeds.
A hurricane is much like a cork floating on liquid, it moves at the same speed as the liquid it is in. Global warming has affected the trade winds that move the air from west to east in the tropical region, from western Africa (where the storms and hurricanes of the Caribbean originate) towards the North Atlantic Basin (Caribbean, Mesoamerica, Gulf of Mexico) that receives them.
The passage of the hurricane is much slower (that of the eye) and we find ourselves with extremely slow speeds (for example, Hurricane Harvey at 7.5 km/h in Texas, 2017). These speeds make the hurricanes and tropical storms spend more time at the same place, and therefore, subject those spaces to extreme amounts of rain.
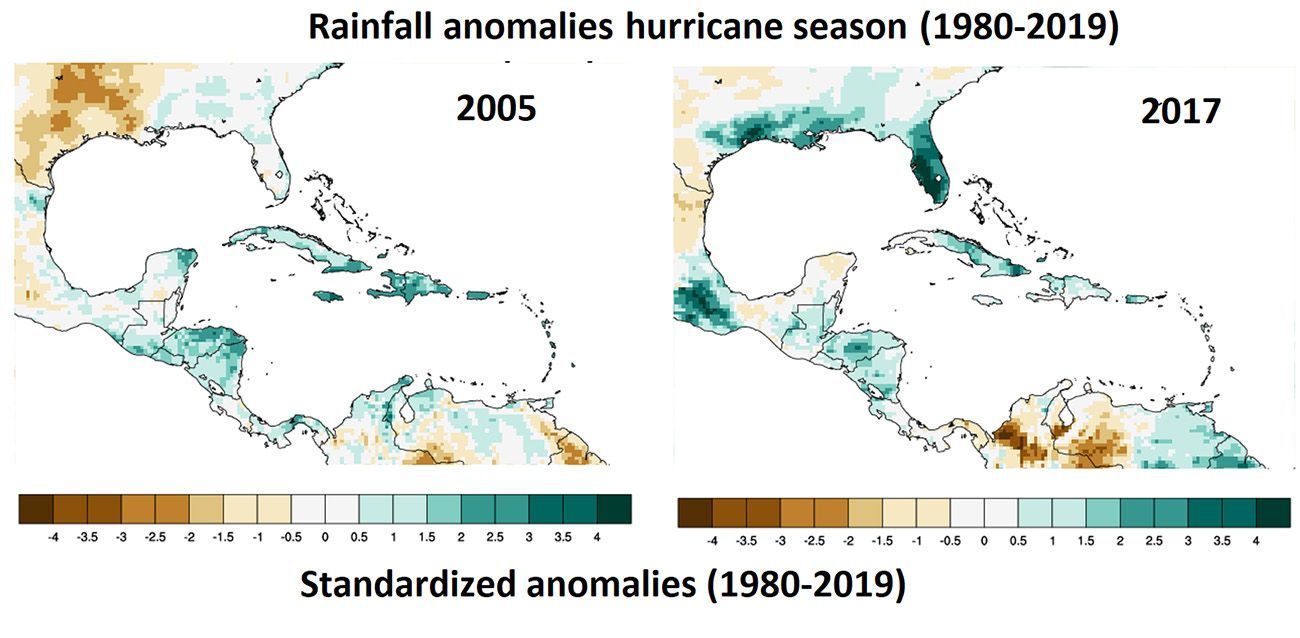
Distribution of the regions most affected by floods (blue tones) during the hurricane season of 2005 and 2017, particularly active in the region. The blue colors represent floods, and the brown tones represent droughts. The values shown are standardized precipitation anomalies in cells of 50 km, in the period from 1980 to 2019. Source: CORESCAM.